Provided by Allen Browne Created: August 2006 Last updated: April 2010.
This article explains a series of tips for crosstab queries.
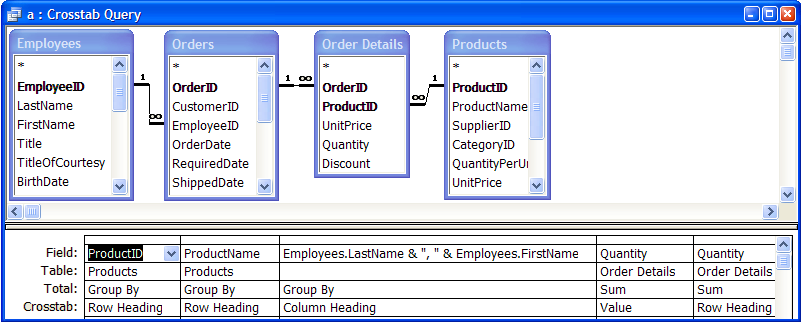
A crosstab query is a matrix, where the column headings come from the values in a field. In the example below, the product names appear down the left, the employee names become fields, and the intersection shows how many of this product has been sold by this employee:

To create this query, open the Northwind sample database, create a new query, switch to SQL View (View menu), and paste:
TRANSFORM Sum([Order Details].Quantity) AS SumOfQuantity
SELECT Products.ProductID, Products.ProductName, Sum([Order Details].Quantity) AS Total
FROM Employees INNER JOIN (Products INNER JOIN (Orders INNER JOIN [Order Details]
    ON Orders.OrderID = [Order Details].OrderID)
    ON Products.ProductID = [Order Details].ProductID)
    ON Employees.EmployeeID = Orders.EmployeeID
GROUP BY Products.ProductID, Products.ProductName
PIVOT [Employees].[LastName] & ", " & [Employees].[FirstName];
To show the total of all the columns in the row, just add the value field again as a Row Heading.
In the example above, we used the Sum of the Quantity as the value. So, we added the Sum of Quantity again as a Row Heading - the right-most column in the screenshot. (The total displays to the left of the employee names.)
In Access 2007 and later, you can also show the total at the bottom of each column, by depressing the Totals button on the ribbon. The button is on the Records group of the Home tab, and the icon is an upper case sigma (Σ).
Where there are no values, the column is blank. Use Nz() if you want to show zeros instead. Since Access frequently misunderstands expressions, you should also typecast the result. Use CCur() for Currency, CLng() for a Long (whole number), or CDbl() for a Double (fractional number.)
Type the Nz() directly into the TRANSFORM clause. For the example above, use:
TRANSFORM CLng(Nz(Sum([Order Details].Quantity),0)) AS SumOfQuantity
A query can ask you to supply a value at runtime. It pops up a parameter dialog if you enter something like this:
[What order date]
Or, it can read a value from a control on a form:
[Forms].[Form1].[StartDate]
But, parameters do not work with crosstab queries, unless you:
a) Declare the parameter, or
b) Specify the column headings.
To declare the parameter, choose Parameters on the Query menu. Access opens a dialog. Enter the name and specify the data type. For the examples above, use the Query Parameters dialog like this:
| Parameter | Data Type |
| [What order date] | Date/Time |
| [Forms].[Form1].[StartDate] | Date/Time |
| [ OK ] | [ Cancel ] |
Declaring your parameters is always a good idea (except for an Access bug in handling parameters of type Text), but it is not essential if you specify your column headings.
Since the column headings are derived from a field, you only get fields relevant to the data. So, if your criteria limits the query to a period when Nancy Davolio made no sales, her field will not be displayed. If your goal is to make a report from the crosstab, the report will give errors if the field named "Davolio, Nancy" just disappears.
To solve this, enter all the valid column headings into the Column Headings property of the crosstab query. Steps:
For the query above, set the Column Headings property like this (on one line):
"Buchanan, Steven", "Callahan, Laura", "Davolio, Nancy", "Dodsworth, Anne", "Fuller, Andrew", "King, Robert", "Leverling, Janet", "Peacock, Margaret", "Suyama, Michael"
Side effects of using column headings:
Where a report has a complex crosstab query as its Record Source, specifying the column headings can speed up the design of the report enormously. If you do not specify the column headings, Access is unable to determine the fields that will be available to the report without running the entire query. But if you specify the Column Headings, it can read the field names without running the query.
An alternative approach is to alias the fields so the names don't change. Duane Hookom has an example of dynamic monthly crosstab reports.
What if you want to show multiple sets of values at each matrix point? Say the crosstab shows products at the left, and months across the top, and you want to show both the dollar value and number of products sold at each intersection?
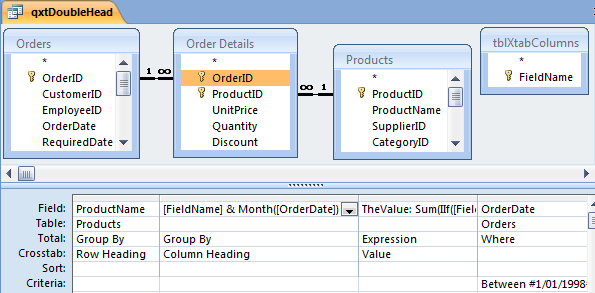
One solution is to add another unjoined table to get the additional set of columns in your crosstab (a Cartesian product.) Try this example with the old Northwind sample database:
The query will look like this:

It generates fields named Amt and the month number, and Qty and the month number:

You can then lay them out as you wish on a report.
For an alternative approach, see kb 304458.
| Home | Index of tips | Top |